
Understand your Categories
Only by understanding your shelf space can you optimize your shelf space, meet your consumers’ demand and eventually increase your profit. But how can you understand your shelves with all those different products, sales, dimensions and stock? This is where Scorpion planogram software comes in. Check out how you can get the most out of your shelf space by using the large variety of analysis and reports available in Scorpion.
Planogram Insights and Reports
What is happening on your shelves?
After planogram prints, insights and reports are two of the three main products created by a planogram tool. The insights that these reports and analysis provide you with are crucial for an optimized shelf space. Examples of reports and analysis are:
- Gap analysis: find actionable gaps in your assortment and increase sales by meeting customer demand.
- Assortment lists: visualize the assortment supplied to each store or customer.
- Cross planogram analysis: compare product performances between stores and identify optimum store planograms.
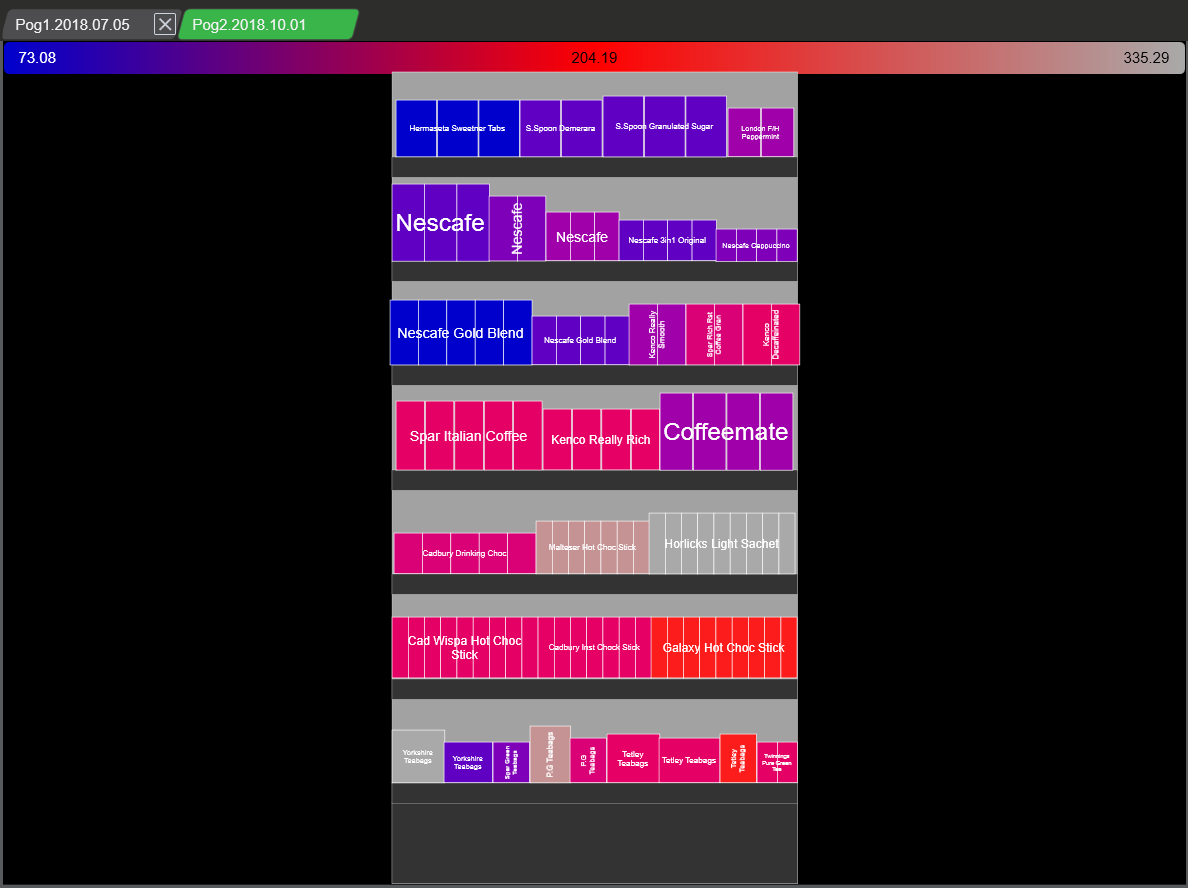
- Hotspot analysis: visualize your product bestsellers and dust collectors (see image on right)
- Days of Supply analysis: manage days of supply and inventory by adjusting stocks on sales data.
Truly understand your product performance by using Scorpion for more in-depth product analysis. Use the unique Power-rank function within Scorpion planogram software which compares your products performances and advises you on your optimum assortment. Scorpion calculates the optimum amount of product facings and increase in sales, providing you with the total sales worth to your business by bay or fixture.
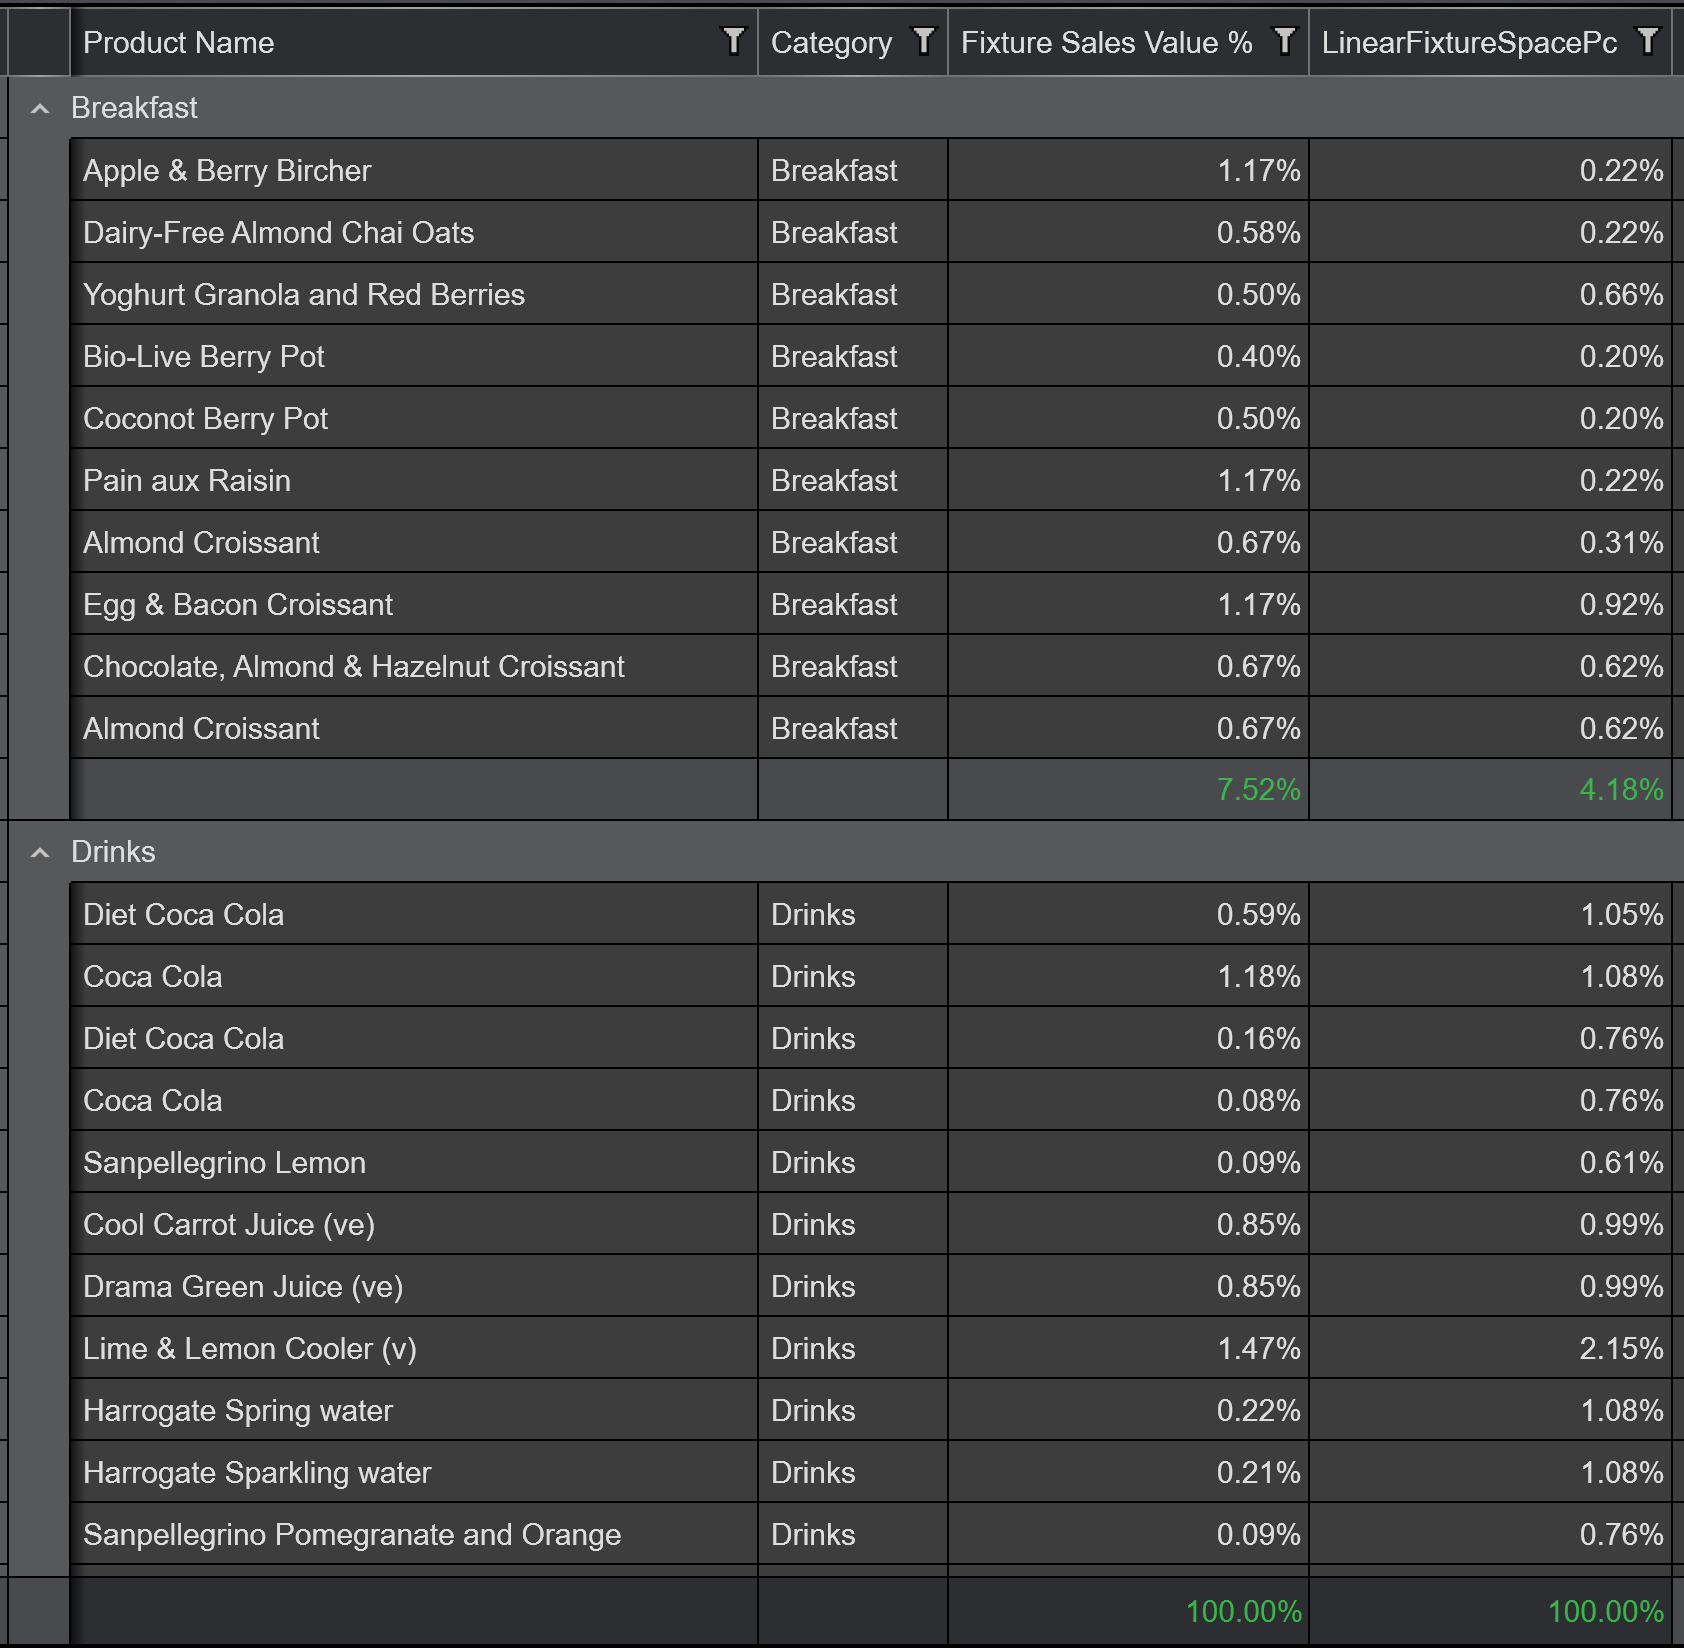
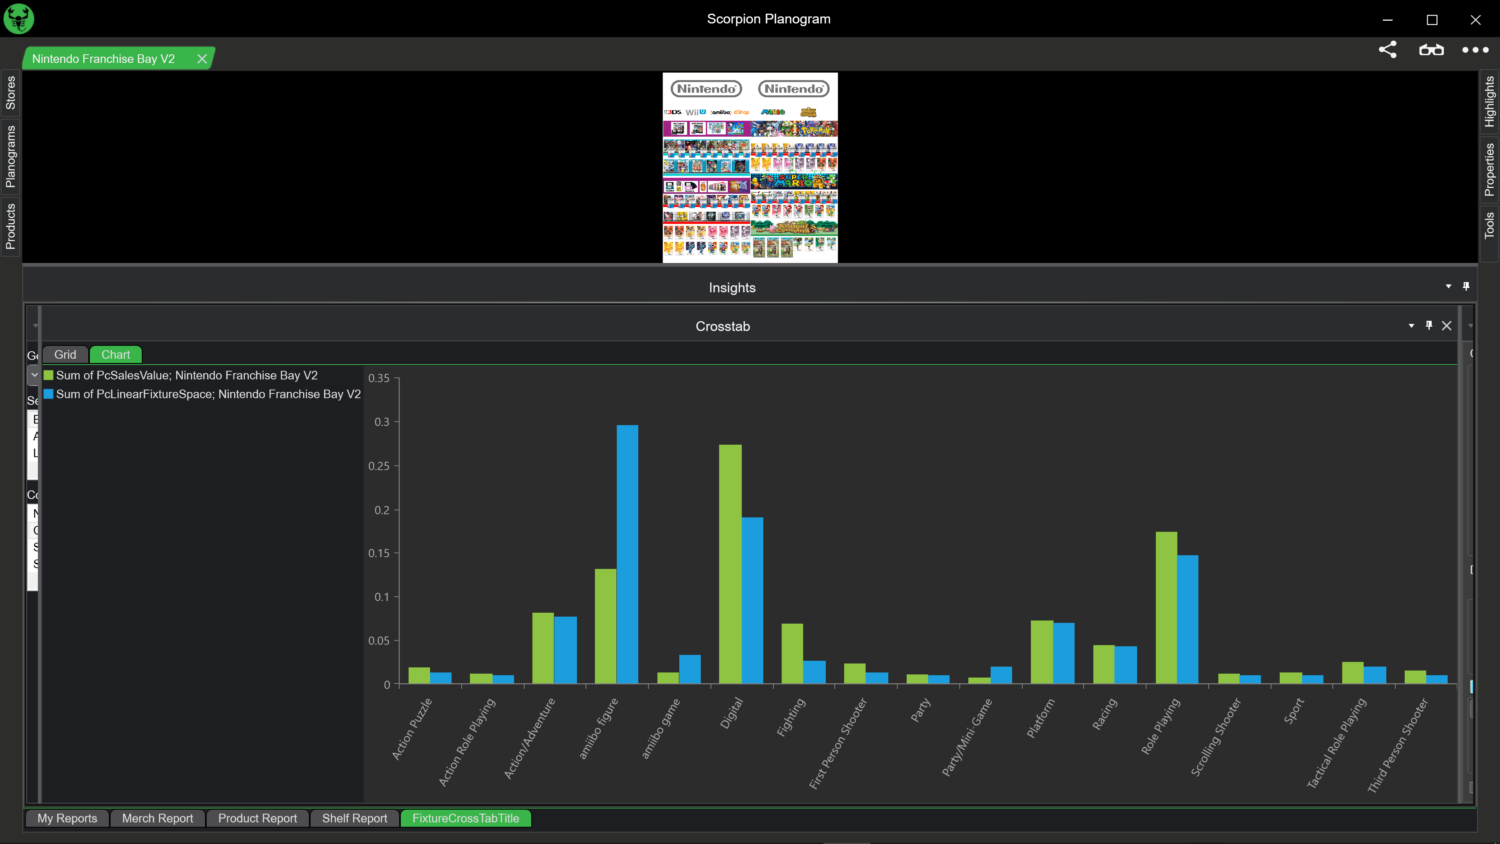
The Space versus Sales analysis provides you with insights into your shelf and store space (see image). These can underline your space allocation decisions for certain products and categories based on their sales data and space they have on your shelves. Use Scorpion’s clear graphs (see image) to justify your space allocation decisions within your company.